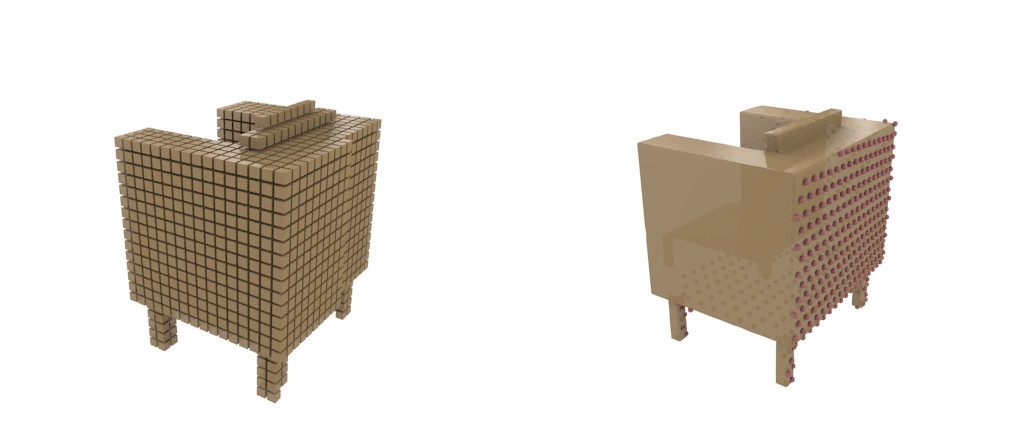
Figure 1 (click to enlarge): Visualization examples of an occupancy grid (left) and a mesh (right) of a chair. The right visualization also shows a point cloud observation (in red).
Blender is an open-source "3D creation suite" — a tool for creating and manipulating 3D shapes and scenes. While I found Blender itself to have a rather steep learning cruve, it does provide a quite extensive Python interface called bpy. For our CVPR'18 and IJCV'20 papers, I used bpy to visualize occupancy grids, meshes and point clouds, see Figure 1. The code, including documentation and examples, is available on GitHub:
Blender Tools on GitHub