Introduction
For proper development and research of deep neural networks, tools such as TensorBoard for monitoring and debugging training are essential. Originally developed for TensorFlow, TensorBoard recently became a standalone package and support has been added to other deep learning frameworks such as PyTorch. As shown in Figure 1, Tensorboard has the advantage of plotting different data types without the need to implement the plotting itself. On the downside, the plots cannot easily be exported and integration with your favorit deep learning framework might be rather tedious and poorly documented.
In this article, I want to show how to easily use Tensorboard in conjunction with PyTorch as a plug-and-play solution. This means that TensorBoard can be used if installed. Without TensorBoard, however, the accumulated data should still be recorded and saved for potential debugging or plotting later. Also, I will show how the TensorBoard logs can be plotted manually, without TensorBoard running. This article will be the first in a series of articles corresponding to my ICML paper []. After this article, introducing the general setup for training, the following articles will discuss practical implementation of adversarial attacks, adversarial training and, finally, confidence-calibrated adversarial training [] — all in PyTorch, modular and easy-to-use.
The code is available on GitHub:
Code on GitHub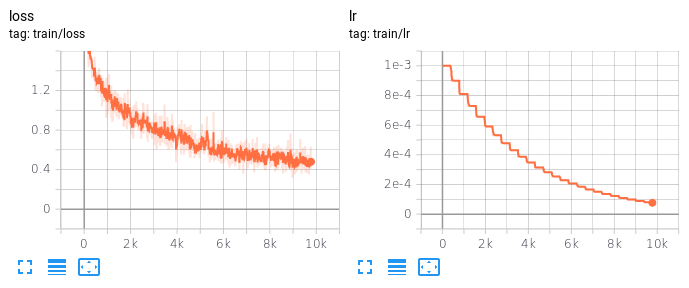
Figure 1: Screenshot from TensorBoard, showing training loss and learning rate as an example. Unfortunately, the plots cannot easily be exported as images or vector graphics.
PyTorch's TensorBoard Summary Writer
Before looking at the training routine and what information to log during training, I will give a brief overview of how the TensorBoard summary writer is interfaced in PyTorch. As shown in Figure 2, taken from the documentation, the constructor takes the log directory as an argument and the functions are generally setup like the add_scalar. The summary writer provides similar functions for logging images or histograms.
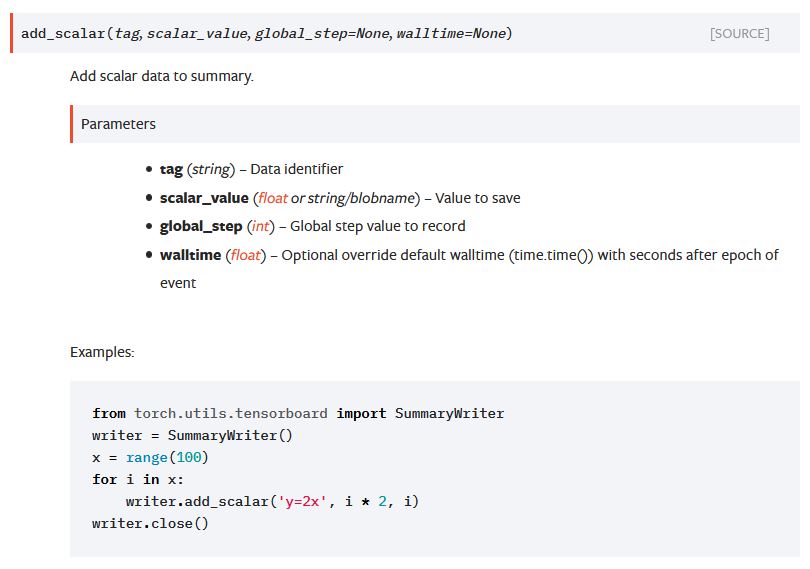
Figure 2: PyTorch documentation entry for add_scalar of the TensorBoard summary writer. Similar functions are provided for logging images, histograms etc.
As I wanted to use TensorBoard in a plug-and-play fashion, I duplicated the summary writer's interface, storing the logged information to a Pickle file instead of TensorBoard logs. This allows to just switch the writer when TensorBoard is not installed. For brevity, the below listing illustrates this for the add_scalar functionality only:
Listing 1: An "empty" summary writer as well as a simple pickle summary writer, following the interface of torch.utils.tensorboard.writer.SummaryWriter, and allowing an alternative if TensorBoard is not available. Note that documentation strings and some functions are stripped for brevity.
# 1. This defines an empty summary writer that can be used to disable logging and defines the interface to inherit from.
class SummaryWriter:
    def __init__(self, log_dir=''):
        pass

    def add_scalar(self, tag, value, global_step=None, walltime=None):
        pass

    # potentially add_image, add_histogram etc.
    # ...

    def flush(self):
        pass


# 2. Simple dict writer that just stores all logged information in a dictionary without saving it on disk.
# Can be used for debugging or tests.
class SummaryDictWriter:
    def __init__(self, log_dir=''):
        self.data = dict()

    def add_scalar(self, tag, value, global_step=None, walltime=None):
        if not tag in self.data:
            self.data = []

        self.data.append((global_step, value))


# 3. Based on the SummaryDictWriter, this summary writer logs everything to a pickle file on disk.
# This allows logging similar to TensorBoard but without the easy plotting and monitoring.
class SummaryPickleWriter(SummaryDictWriter):
    # 3.1 Constructor just sets up the log directory and file and a queue to make sure
    # all information is written in regular intervals.
    def __init__(self, log_dir, max_queue=50, **kwargs):
        # such options allow to disable logging of specific data to keep the pickle file small
        self.scalar = kwargs.get('scalar', True)

        log_file = os.path.join(log_dir, 'events.pkl')
        if os.path.exists(log_file):
            os.unlink(log_file)
        if not os.path.exists(log_dir):
            os.makedirs(log_dir)

        self.log_file = log_file
        self.max_queue = max_queue
        self.queue = 0
        self.data = dict()

        if os.path.exists(self.log_file):
            with open(self.log_file, 'rb') as handle:
                self.data = pickle.load(handle)

    def __del__(self):
        self.flush()

    # 3.2 This makes sure that logged information is written to file in regular intervals.
    def update_queue(self):
        self.queue += 1
        if self.queue >= self.max_queue:
            self.flush()
            self.queue = 0

    def add_scalar(self, tag, value, global_step=None, walltime=None):
        if self.scalar:
            if not tag in self.data:
                self.data = []

            self.data.append((global_step, value))
            self.update_queue()

    # 3.3 Note that we append to the pickle file as the data dictionary
    # is cleared after every flush in order to reduce memory usage.
    # (logging images, histograms etc. can get memory intensive for large models/datasets)
    def flush(self):
        assert len(self.data) <= self.max_queue + 1
        with open(self.log_file, 'ab') as handle:
            pickle.dump(self.data, handle, protocol=pickle.HIGHEST_PROTOCOL)
            self.data.clear()
            assert len(self.data) == 0
- Note that this "empty" summary writer mostly follows the interface of
torch.utils.tensorboard.writer.SummaryWriterin order to be exchangable. Additionally, it allows to turn off monitoring (for disk space or runtime reasons) by just switching from the TensorBoard writer to this "dummy" writer. - A simple dictionary writer, storing all logged information in a
dictin memory, can be used for debugging or testing — or for smaller datasets and networks. - As real alternative to TensorBoard's summary writer, this writer stores all logged information in a pickle file:
- Similar to the TensorBoard writer, the constructor expects a log directory and sets up an empty data dictionary and a queue counter.
- The data is regularly written to file using
flushwhen the queue counter exceeds the maximum ququ counter. - Note that we are appending to the pickle files and emptying the data dictionary afterwards to keep a low memory profile.
As a result, these summary writers are interchangeable with PyTorch's TensorBoard writer. Next, I will show the actual traininig procedure showing what information to log during training.
Training Routine
The general training routine, shown in Listing 2, is held simple and mostly follows basic PyTorch tutorials. However, I made it a bit more modular: there is a train and test routine which can be called alternatingly for several epochs to perform training. The trainer just expects a training and test set — as torch.utils.data.DataLoader — and an optimizer as well as a learning rate scheduler. More importantly, however, the trainer can be used either with TensorBoard's summary writer or one of those in Listing 1.
Listing 2: Trainign routine including logging of essential information for debugging. Note that comments and documentation strings are omitted for brevity.
class NormalTraining:
    def __init__(self, model, trainset, testset, optimizer, scheduler, augmentation=None, loss=common.torch.classification_loss, writer=common.summary.SummaryWriter(), cuda=False):
        # set attributes
        # ...

        # 1. Log the training setup, so details such as architecture, training set or optimizer can be
        # determined in TensorBoard directly.
        self.writer.add_text('config/model', self.model.__class__.__name__)
        self.writer.add_text('config/model_details', str(self.model))
        self.writer.add_text('config/trainset', self.trainset.dataset.__class__.__name__)
        self.writer.add_text('config/testset', self.testset.dataset.__class__.__name__)
        self.writer.add_text('config/optimizer', self.optimizer.__class__.__name__)
        self.writer.add_text('config/scheduler', self.scheduler.__class__.__name__)
        self.writer.add_text('config/cuda', str(self.cuda))

        self.writer.add_text('model', str(self.model))
        self.writer.add_text('optimizer', str(common.summary.to_dict(self.optimizer)))
        self.writer.add_text('scheduler', str(common.summary.to_dict(self.scheduler)))

    def train(self, epoch):
        self.model.train()
        assert self.model.training is True

        # 2. The training routine is held simple, setting up inputs and targets,
        # zeroing the optimizer's gradients and finally doing a forward and backward
        # to update the paraemters.
        for b, (inputs, targets) in enumerate(self.trainset):
            if self.augmentation is not None:
                inputs = self.augmentation.augment_images(inputs.numpy())

            inputs = common.torch.as_variable(inputs, self.cuda)
            assert len(targets.shape) == 1
            targets = common.torch.as_variable(targets, self.cuda)
            assert len(list(targets.size())) == 1

            self.optimizer.zero_grad()
            logits = self.model(inputs)
            loss = self.loss(logits, targets)
            error = common.torch.classification_error(logits, targets)
            loss.backward()

            self.optimizer.step()
            self.scheduler.step()

            # 3. Basic information such as learning rate, loss, error or the mean confidence
            # can be logged using scalars (so these will become line plots in TensorBoard).
            # Note that global step defines the x-value of the line plot.
            global_step = epoch * len(self.trainset) + b
            self.writer.add_scalar('train/lr', self.scheduler.get_lr()[0], global_step=global_step)
            self.writer.add_scalar('train/loss', loss.item(), global_step=global_step)
            self.writer.add_scalar('train/error', error.item(), global_step=global_step)
            self.writer.add_scalar('train/confidence', torch.mean(torch.max(common.torch.softmax(logits, dim=1), dim=1)[0]).item(), global_step=global_step)

            # 4. Optionally, logits, confidences and weight statistics can be logged as histograms over the current batch
            # This is, however, more space intensive in the final log file.
            if self.summary_histograms:
                self.writer.add_histogram('train/logits', torch.max(logits, dim=1)[0], global_step=global_step)
                self.writer.add_histogram('train/confidences', torch.max(common.torch.softmax(logits, dim=1), dim=1)[0], global_step=global_step)

            j = 0
            for parameter in self.model.parameters():
                self.writer.add_scalar('train/weight/%d' % j, torch.mean(torch.abs(parameter.data)).item(), global_step=global_step)
                self.writer.add_scalar('train/gradient/%d' % j, torch.mean(torch.abs(parameter.grad.data)).item(), global_step=global_step)
                if self.summary_histograms:
                    self.writer.add_histogram('train/weights/%d' % j, parameter.view(-1), global_step=global_step)
                    self.writer.add_histogram('train/gradients/%d' % j, parameter.grad.view(-1), global_step=global_step)
                j += 1

            # 5. Images can also be logged, this is useful for debugging data augmentation schemes.
            self.writer.add_images('train/images', inputs[:16], global_step=global_step)

    def test(self, epoch):
        self.model.eval()
        assert self.model.training is False

        losses = None
        errors = None
        logits = None
        probabilities = None

        # 6. The testing routine goes over the test set once and saves logits, errors, losses and probabilities to be logged.
        for b, (inputs, targets) in enumerate(self.testset):
            inputs = common.torch.as_variable(inputs, self.cuda)
            targets = common.torch.as_variable(targets, self.cuda)

            outputs = self.model(inputs)
            b_losses = self.loss(outputs, targets, reduction='none')
            b_errors = common.torch.classification_error(outputs, targets, reduction='none')

            losses = common.numpy.concatenate(losses, b_losses.detach().cpu().numpy())
            errors = common.numpy.concatenate(errors, b_errors.detach().cpu().numpy())
            logits = common.numpy.concatenate(logits, torch.max(outputs, dim=1)[0].detach().cpu().numpy())
            probabilities = common.numpy.concatenate(probabilities, common.torch.softmax(outputs, dim=1).detach().cpu().numpy())

        # Note that the logged test values are on a separate x axis, directly corresponding to the epoch.
        # The logged information pretty much corresponds to the the training routine.
        confidences = numpy.max(probabilities, axis=1)
        global_step = epoch

        self.writer.add_scalar('test/loss', numpy.mean(losses), global_step=global_step)
        self.writer.add_scalar('test/error', numpy.mean(errors), global_step=global_step)
        self.writer.add_scalar('test/logit', numpy.mean(logits), global_step=global_step)
        self.writer.add_scalar('test/confidence', numpy.mean(confidences), global_step=global_step)

        if self.summary_histograms:
            self.writer.add_histogram('test/losses', losses, global_step=global_step)
            self.writer.add_histogram('test/errors', errors, global_step=global_step)
            self.writer.add_histogram('test/logits', logits, global_step=global_step)
            self.writer.add_histogram('test/confidences', confidences, global_step=global_step)

        return probabilities
- Besides setting attributes (including the model, optimizer, learning rate scheduler etc.), the constructor mainly takes care for logging some meta information. Here, for example, I log the used optimizer, scheduler and model including its haper-parameters such as learning rate. However, this could also be used to log random seeds or similar information to make the code reproducible.
- The training routine is held very simple: get inputs and targets (on GPU), zero the optimizer's gradients, make a forward and backward pass and an optimizer step. This basically follows most PyTorch tutorials.
- After the training step, some basic information can be logged as scalars, i.e., using
add_scalar: the learning rate, the loss and error or the mean confidence. Note thatglobal_stepis set to the current training iteration (not epoch). - More informative, however, are the actual distributions of logits, confidences or weights as they evolve during training. To this end,
add_histogramcan be used for logging. However, this quickly increases the size of the corresponding log files. - When using heavy data augmentation or performing adversarial training (i.e., on adversarial examples), logging all or some of the used training images can also be helpful. Here, I use
add_imagesto log a part of the augmented training images. Note that this is not done during evaluation (as no data augmentation is used on the test set). - The test routing goes over the test set once, storing losses, errors, logits and probabilities per example. THis allows to log the overall test error, test loss as scalars as well as the corresponding distributions using
add_histogram. Note thatglobal_stepis set to the epoch and, thus, represents a different x-axis than the data logged during training.
The advantage of the above training code in Listing 2 in combination with the summary writers from Listing 1 is that TensorBoard logging can be used plug-and-play. Alternatively, the dummy logger (i.e., SummaryWriter in Listing 1) can be used to disable logging completely (also eliminating any overhead) or the logs can be written to a pickle file. This also enables various strategies for monitoring — using TensorBoard or and custom plotting code.
Monitoring using TensorBoard
For monitoring using TensorBoard, no custom plotting functions are necessary. Thus, this is the easiest way of debugging — even though there are some disadvantages as I will discuss later. For using TensorBoard, Listings 1 and 2 can be put together as follows:
Listing 3: Putting Listings 1 and 2 together results in a short and simple training script that allows to switch between TensorBoard logging using torch.utils.tensorboard.SummaryWriter and the customer summary writers from Listing 1.
# Setup training and testing data loaders
# ...
# Set up training directory.
directory = './checkpoints/'

# Setup model to use.
model = Net()
if cuda:
    model = model.cuda()

# Setup optimizer and scheduler.
# A simple exponential scheduler is used, check the repository for details.
optimizer = torch.optim.Adam(self.model.parameters(), lr=0.001)
scheduler = common.train.get_exponential_scheduler(optimizer, batches_per_epoch=len(self.trainloader), gamma=0.9)

# Create a summary writer
# PyTorch's TensorBoard writer can be used out-of-the-box using Listing 2.
dt = datetime.datetime.now()
# writer = common.summary.SummaryPickleWriter('%s/logs/%s/' % (directory, dt.strftime('%d%m%y%H%M%S')), max_queue=100)
writer = torch.utils.tensorboard.SummaryWriter('%s/logs/%s/' % (directory, dt.strftime('%d%m%y%H%M%S')), max_queue=100)

trainer = common.train.NormalTraining(self.model, self.trainloader, self.testloader, optimizer, scheduler, writer=writer, cuda=cuda)
# Optionally enable to log logit/loss distributions; will increase log size significantly.
#trainer.summary_histograms = True

# Training iterations:
epochs = 50
for epoch in range(0, epochs):
    trainer.step(epoch)
    writer.flush()

# Save the model.
model_file = '%s/classifier.pth.tar' % directory
torch.save(self.model.state_dict(), model_file)
Using this code, all TensorBoard log files will be written to the logs/ subdirectory. TensorBoard can be launched using this directory and will show multiple training runs based on the datetime. In practice, this can be done using:
python3 -m tensorboard.main --logdir=./checkpoints/logs/ --host=localhost --port=6006
In the repository, the full example can be found in examples/train.py and run using python3 train.py.
Custom Plotting and Monitoring
There are some disadvantages to using TensorBoard. Although it allows easy monitoring during training and the plots are responsive as well as interactive, the data can only be exported as CSV files. The plots, in contrast, cannot be exported easily or recreated for papers, presentations or the like. Furthermore, TensorBoard is tricky to extent to include custom plots or visualizations and cannot easily be automated (i.e., to produce plots for various training runs). In the repository, I provide two alternatives to address these issues: First, using the SummaryPickleWriter from Listing 1. It is mostly meant to allow custom plotting after training opposed to monitoring and debugging training. And second, directly reading the TensorBoard log files for customer plotting. In the following, I will present a brief example illustrating the second option using code from lab-ml/labml:
Listing 4: Reading TensorBoard logs can be difficult this is also due to limited documentation. This listing shows an example of how to read scalars from TensorBoard logs.
import os
import numpy
# The EventAccumulator is the main interface to read TensorBoard log files.
from tensorboard.backend.event_processing.event_accumulator import EventAccumulator


class Event:
    """ Represents an individual logged event. """
    def __init__(self, step, tensor):
        self.step = step
        self.tensor = tensor

class TensorBoardAnalytics:
    def __init__(self, log_path):
        """ Find log file and set up EventAccumulator. """
        assert os.path.isfile(log_path) or os.path.isdir(log_path)
        if os.path.isdir(log_path):
            assert len(os.listdir(log_path)) > 0
        self.event_acc = EventAccumulator(log_path, size_guidance={'tensors': 1000})

    def load(self):
        """ Load log, needs to be called at least once. """
        self.event_acc.Reload()

    def tags(self):
        """ Get a list of tags present in the logs. """
        return self.event_acc.Tags()

    def scalar(self, name):
        """ Read a series of scalars. Returns a list of Event. """
        name = name.replace('.', '/')
        events = self.event_acc.Scalars(name)
        return [Event(e.step, numpy.array([e.value])) for e in events]

    # Similar functions can be implemented for histograms, images etc.
The main tool for reading TensorBoard files is tensorboard.backend.event_processing.event_accumulator.EventAccumulator. Unfortunately, documentation is a bit thin, also because it seems to have changed over the years such that some StackOverflow answers may be outdated. The event accumulator can be used to "open" a TensorBoard log file and read, for example, scalars using the Scalars method. It returns events consisting of a step (i.e., the iteration or epoch from Listing 2) and a corresponding value.
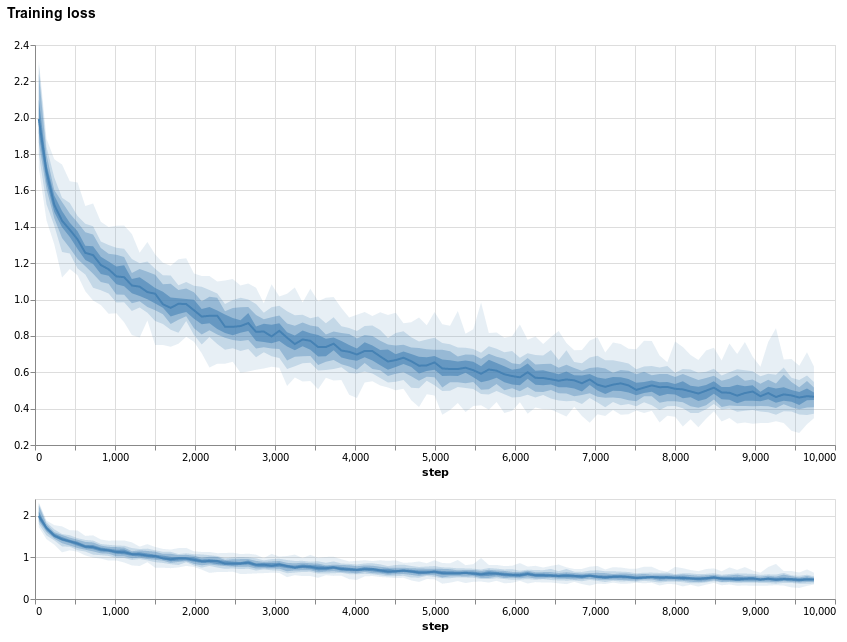
Figure 3: Screenshot from the training loss visualized using the Altair code from lab-ml/labml.
The lab-ml/labml repository uses Altair for interactive visualization, as illustrated in Figure 3. However, given the read events, Matplotlib could be used as easily for plotting.
Conclusion
In this article, I discussed how to use TensorBoard to monitor neural network training in PyTorch. While PyTorch does provide functionality to log to TensorBoard files, usage can be tricky, also because documentation and examples on the web are limited. Furthermore, I also outlined some disadvantages when only using TensorBoard for logging, such as limited export options for TensorBoard plots.
To address these issues, I presented a simple way of using TensorBoard in a plug-and-play fashion, by implementing alternative summary writers with the same interface as the TensorBoard writer provided by PyTorch. Additionally, I showed how TensorBoard log files can be read programmatically in PyTorch to create custom plots.
Besides, this article was also meant to introduce the code base for the following articles, to introduce adversarial attacks, adversarial training and our confidence-calibrated adversarial training [] in the following articles.
- [] D. Stutz, M. Hein, B. Schiele. Confidence-Calibrated Adversarial Training: Generalizing to Unseen Attacks. ICML, 2020.